If you run an online business, you need to continuously evaluate its performance to understand whether you are doing good. Speaking about ecommerce, with such a wide range of indicators Google Analytics provides, it is easy to get lost and let the most strategical metrics out of your sight.
This post is to provide you with the ready-to-use steps how to calculate the core business KPIs with the help of Google Analytics data.
Let me note, that for tightening together web traffic and financial goals, ecommerce tracking and goals set up are must-haves in your Google Analytics account. How to set up goals and ecommerce tracking you can read here and here.
KPI #1. Cost of Customer Acquisition.
Shows how much you invested in online marketing to acquire one customer from the whole group of customers. To calculate it, divide total marketing campaign costs by number of customers acquired. To get actionable insights, evaluate traffic channels (organic, paid, social, referral) and online campaigns (discounted offer by email, cobranded webinar, giveaway) separately.
САС = МСС ÷ СА
| CAC | Cost of customer acquisition |
| MCC | Total marketing campaign costs related to acquisition (not retention) |
| CA | Total customers acquired |
To get the number of customers acquired in Google Analytics, set up a goal that will represent a purchase on your site. Enable ecommerce, then go to the reports on marketing campaign or channel results and check the Conversions block. See Image 1.
You are free to name your goal as you like, it this case it is Sale Success. Please mind, that to avoid discrepancy and count only new visitors, make sure to select a default segment in Google Analytics - New Users.
Please click on screenshots to see a larger version.
KPI #2. Conversion Rate of a channel/campaign.
It says what percentage of visits to your site has been transformed into potentials leads. To estimate the Conversion Rate, a total number of conversions are divided by total number of visits.
What kind of actions should be treated as conversions depends on your goals. You may set up various ecommerce goals (add to shopping cart, completed sign-up form, number of pages viewed, etc.) and track their Conversion Rate separately.
It is better to estimate Conversion Rate per channel or campaign. Conversion Rate is frequently used to measure landing page effectiveness, as it gives insights on what page has the best content and provides the most optimal user experience.
KPI #3. Shopping Cart Abandonment Rate.
Shows the percentage of visits during which a user has added item to the shopping cart, but hasn’t reached the check-out point. The metric is calculated as a division of number of orders placed by the number of shopping carts created.
In online retail this metric is essential. Difference between shopping experience at brick-and-mortar store and online generates a wide range of factors which distract users or make impossible to complete the purchase online. As a result, the abandonment carts rate has a big impact on sales volume.
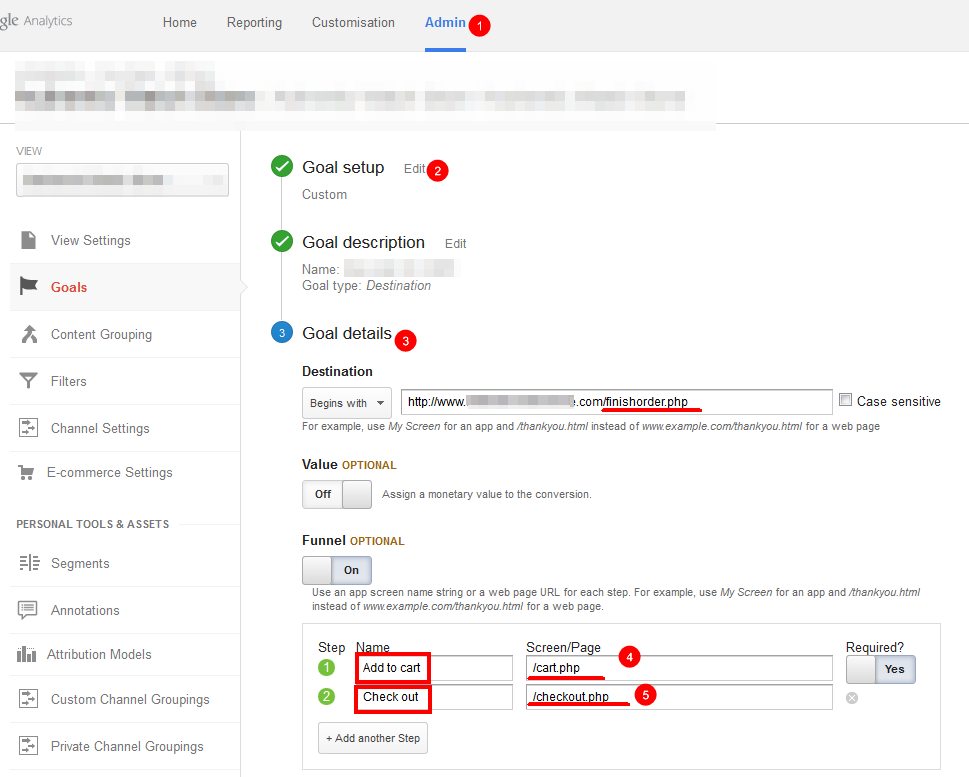
In Google Analytics this metric is easy to get and even visualize with several goals setup. Firstly, create in Google Analytics at least two goals: 1) the one which tracks the number of time users completed the add to cart action 2) the one which signals about the check-out success or thank you page viewed by the user.
Next step - use the URLs of those two pages to create a Funnel in Google Analytics. When it is created, go to the Funnel Visualization report and check the numbers. In the Image 4 only 278 visitors proceeded to the payment stage, which means Shopping Cart Abandonment Rate in this case is 61.23%.
KPI #4. Average Order Value.
A simple and well-known metric, which is calculated as revenue received from sales divided by the number of orders taken.
Average Order Value can be quickly accessed in Ecommerce reports section. This is why setting up ecommerce tracking is so important. Of course, Average Order Value for all traffic sources is too vague to find any clear answers. That is why I would recommend making use of default or custom segments in Google Analytics which will help you filter out the data or apply Magento 2 custom filter.
The list is by far is not exhaustive. However, these 4 metrics could be a good starting point. If you’d like to find out more about business metrics which ecommerce store may use, please leave your feedback and suggestion in the comments below. If you happen to have any questions when applying any of these reports for your web property, free to drop me a line and ask for help. Monitor your Magento store KPIs using the advanced reporting tool.


