You need to have statistical data to sell not worse than Amazon and manage your business by making data-driven decisions. Advanced Reports for Magento 2 gets you the current information about your customers’ behavior. This extension provides 20+ detailed report types that are merged into 3 big groups: sales, catalog, and customers.
Basic features of Advanced Reports and how to work with them
By default, Magento 2 offers 20 reports about Marketing, Reviews, Sales, Customers, and Products. But what if you want, for example, to know how many Nike sneakers were sold this month. Or maybe you need to compare sales in the Q1 2019 and Q1 2020. Usually, store owners use Google Analytics for these purposes. But with our extension, you can see all the data right in the admin panel. Let’s consider some examples to make it clear.
Example #1
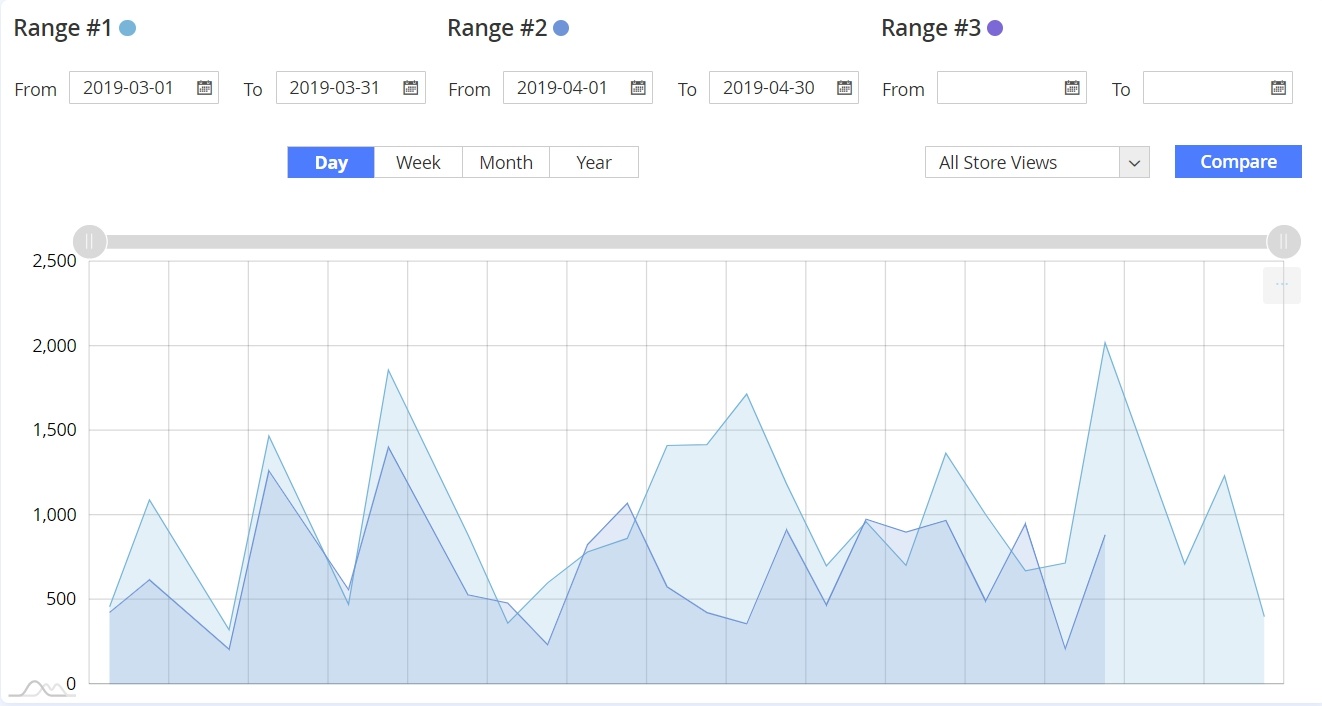
Say, you need to analyze users’ behavior in summer. For this, you can compare summer sales in different years. Our extension includes the Sales Comparison report. Go to Reports > Advanced Reports and click Sales Comparison on the left panel. There you can set 2 or 3 data Ranges, choose the needed store view, and click Compare. Then, you will get the result like this:
On the chart, you can see if your sales are higher or lower than in previous years and analyze if you have any seasonal features.
Also, you can download or print this image and use it for presentation or any other purposes.
Example #2
Say, you own a multi-brand store. Thus, you need to understand what brands are the most popular among your customers and correct your purchasing and marketing strategy according to this data. In the catalog section of our extension, you can find the By Brands report.
Configure the reporting period, choose the needed store view, and the plugin will display the chart with the info about how many items of a specific brand were sold, and how much revenue you got.
From the table placed under the chart, you will get more detailed information: data about taxes, discounts, orders, and refunds:
Hide unnecessary columns, change their order, apply filters. Export the data in CSV or XML formats for further analysis and team meetings.
Example #3
Finally, we want to show how you can create a custom report for a specific request.
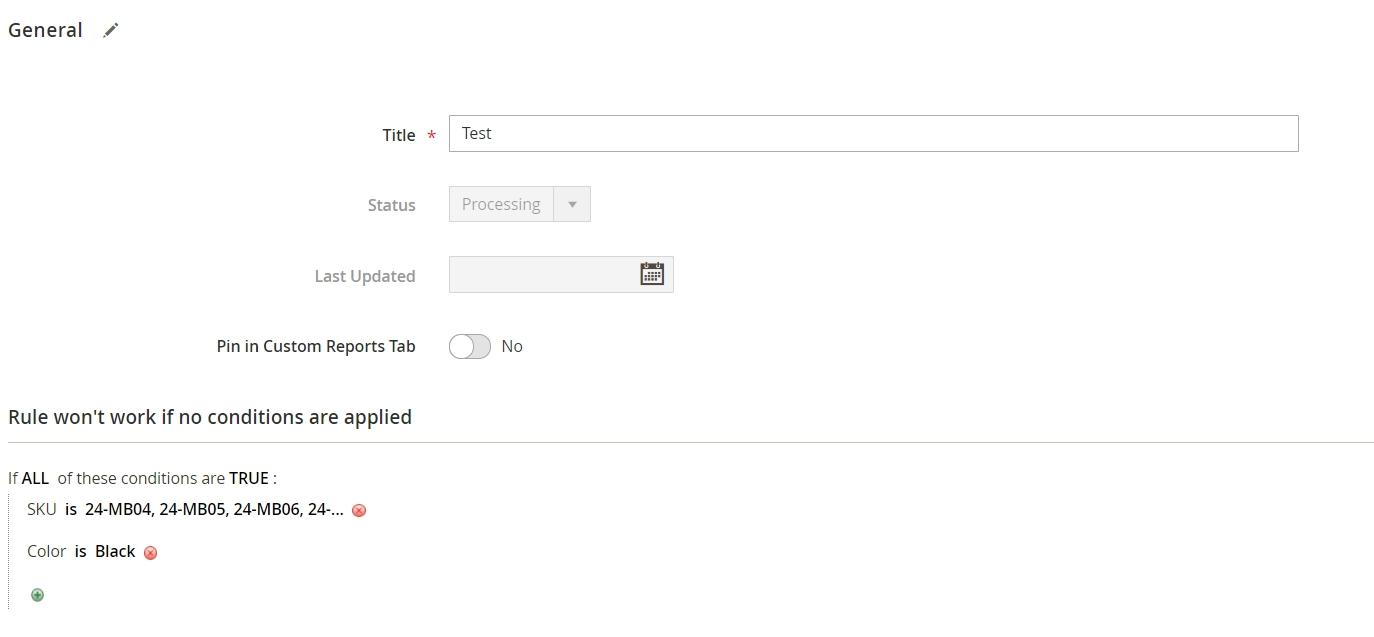
For this, go to Reports > Advanced Reports Rules or Reports > Advanced Reports > Custom Reports > New Rule and click Add New Rule. There you can set conditions for a custom report:
After you save the rule, a new report will appear in the Custom Reports section.
Set up the extension following this step-by-step guide→
The latest update
Advanced Reports v. 1.5
#1. New ‘Conversion Rate’ report
Now, the extension includes a new report which lets you check the conversion rate of the store and see how it changes with time. Analyzing the effectiveness of your marketing strategy, you won’t miss a thing influencing your revenue.

#2. New ‘Custom Reports’ section
If you use custom reports, now you can get access to them in one click with a special section we added for them. Create any report you need based on rules and analyze them on separate grids.
#3. Graphs design update
Now it's possible to visualize the same reports with different types of diagrams. Download, print, and use these images as visual aids for your reports:
Previous updates
Advanced Reports v. 1.1
#1. New 'Sales by Attribute Set' report
We've added the Sales by Attribute Set report to the Catalog group. Now, you can not only control separate product attributes like size, color, gender, but also track which attribute combination is the most popular among your customers. Set the period and choose the necessary attribute range to get detailed sales data:

#2. Improved Sales by Product report
We have added new columns to this report for quantity:
- sold;
- ordered;
- canceled;
- refunded.
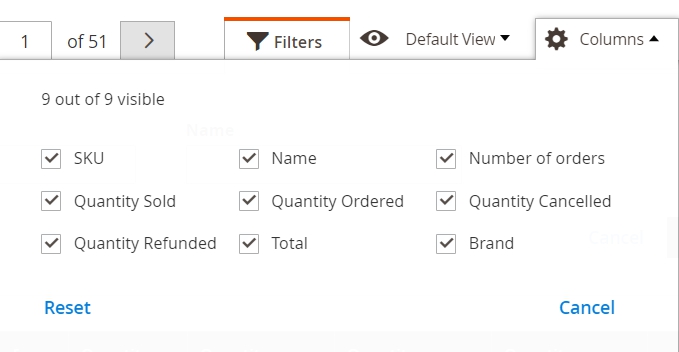
Define what products are refunded more often. You can tick them in the Column dropdown, in the upper-right corner:

Also, now you can additionally apply a rule based on Category, Attribute, Brand, to see a report for products from a specific category or with a certain attribute:

#3. The ‘Sales Comparison’ report
We’ve added the ‘Sales Comparison’ report where you can see the dynamic of your sales for different periods and analyze how they are changing:

Advanced Reports v. 1.2 and 1.3
#1. New ‘Sales by Cart Price Rules’ report
We added the ‘Sales by Cart Price Rules’ report to the Sales group. This new report helps you check the use of shopping cart price rules in your Magento 2 store. Now you can compare different rules and analyze their effectiveness. Customize the report for your needs – sort your price rules by:
• Number of Orders;
• Items Ordered;
• Subtotal;
• Tax;
• Shipping;
• Discounts;
• Total;
• Invoiced;
• Refunded;
• Cart Price Rule.
Now you will need only one look at the chart to understand what’s going on with your sales. The Quantity graph is the number of customers that use cart price rules. The Total chart shows the money that these customers spent at your store.
#2. New ‘Sales by Brands’ report
Running a multi-brand Magento 2 store? Then you’ll be happy to learn that we added Sales by Brands report to the Catalog group. Now you can see what brands are popular among your customers and manage your marketing strategy with that in mind.
Customize this report table to make it meet your demands – use filters and column settings.
The columns in the graph clearly represent the demand of each brand in your store. But you can change this report and choose any other Product Attribute for Brands Report in extension settings. So you will get quick access to information about the most popular sizes, colors, materials and more. And you don’t need to choose this attribute every time, it will be saved in settings.
Also, you can see the Brand column in the report By Product. Thus, you can go to this brand report in one click.
Export the data in CSV or XML with correct information in tables and tooltips. You can use this file as a base for your monthly reports.
#3. ‘Sales Overview’ report update
The ‘Sales Overview Report’ has 2 main novelties. Now you can track the most important sales information on one page.
1. You can choose the percentage format for your report. Count daily percent of your income, taxes, orders, refunded money in one click. Check your day-to-day progress in 3 seconds.
2. Also, we introduced a new line with the total values of the columns. This feature allows you to use this tab as a quick and detailed financial report.
#4. The amCharts library update
We updated the amCharts library, now you can save data as PNG, JPG, SVG, or PDF files for all Magento 2 reports. Use these images to illustrate your presentations, reports, and offers. Now your business partners, stakeholders, and employees will understand their work results.
Advanced Reports v. 1.4
#1. New ‘Abandoned Carts' report
Do you know that the average abandonment rate in e-commerce is around 70%?
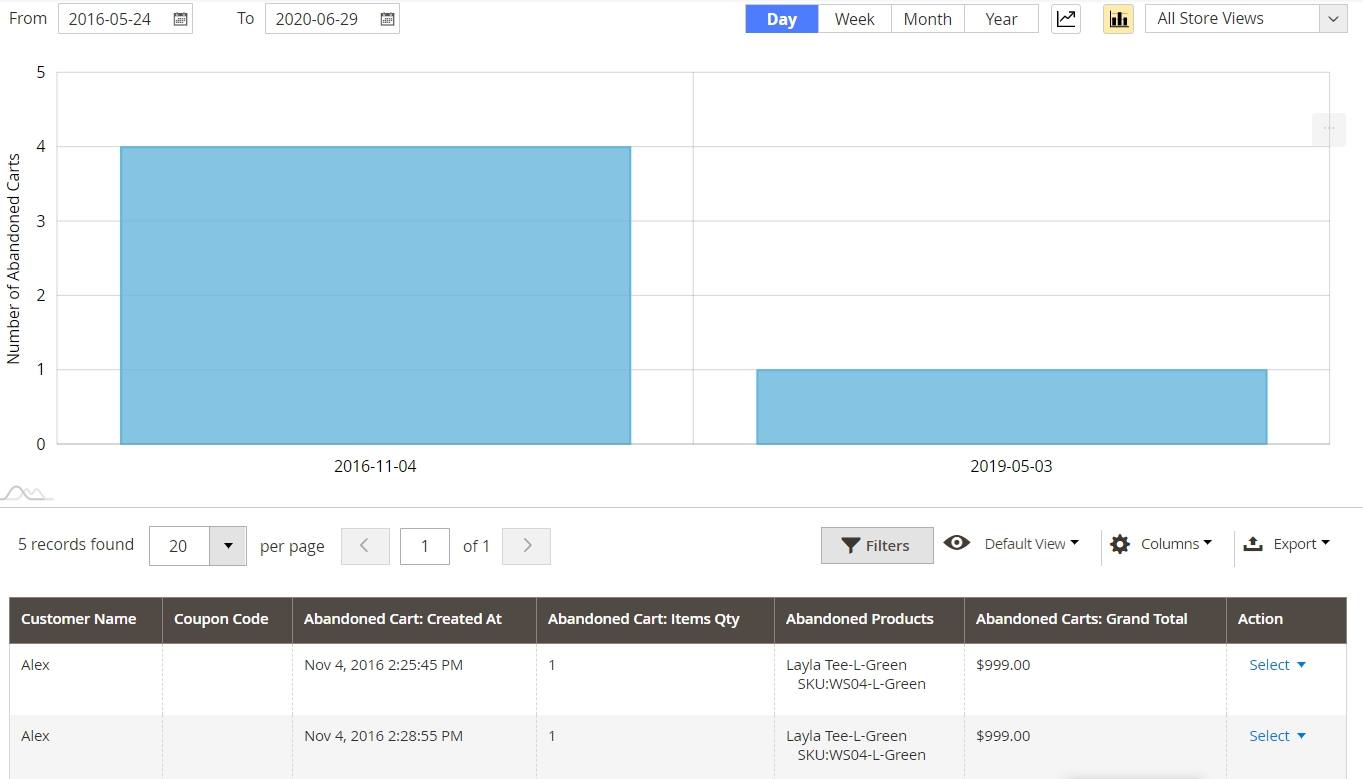
In our new ‘Abandoned Carts' report, you’ll see how many cart abandonments you have, what users leave their carts without finishing the purchase, and create a unique approach to retain more customers:
→Read how to recover up to 10% of abandoned carts
#2. New ‘Product Performance’ report
In this report, you can check the information about a specific product:
- how many times it was ordered;
- how much revenue it gained;
- who placed orders with this product;
- and much more.
#3. New ‘Order Item’ report
This report provides the possibility of splitting orders per separate item. Thus, you can analyze order data much deeper:
#4. ‘Today & Live’ block
Now you can get a short overview of your current situation in-store by clicking on a new ‘Today & Live’ block on Dashboard. It helps you estimate what is going on in your shop right now:

In conclusion
Are you tired of building a business strategy on guesses? Make informed decisions with Advanced Reports Magento 2.
Haven’t found the feature you need? Leave your request here.
Stay in touch and don’t miss new big updates!
Additional resources
→ The full list of the latest extensions updates
→ Fix 404 error in default M2 Reporting


